Cell Segmentation
Outline each cell body in a fluorescence image, then score the predicted boundaries against a human annotation.
Segment every individual cell body in the supplied fluorescent cultured neural cells. Return a separate outline for each cell, including cells that touch one another. Outline the cell body and clearly delineated attached cytoplasm. Do not count an isolated nuclear signal without a visible cell body, or bridge faint diffuse processes between different cells.

The image is 512 pixels wide and 383 pixels high. Use the original image coordinates: [x,y], origin at the top-left pixel center, x increases rightward, y downward. Pixel centers have integer coordinates. Boundary vertices may range from -0.5 to 511.5 on x and -0.5 to 382.5 on y. Include visible portions of cells cut by the image edge; clip their outlines to the image boundary. Do not invent contours outside the field.

Return only one JSON object of this form: {"cells":[{"rings":[[[x1,y1],[x2,y2],[x3,y3]]]}]}. Each entry in cells is one cell. Usually it needs one ring: an ordered list of at least three boundary points, closed automatically. Additional rings use even-odd filling: nested rings exclude holes and disjoint rings describe disconnected parts of that same cell. Rings must not self-intersect. Ring direction, starting point, and cell order do not matter. Different cells may overlap where the image supports it. If no cells are present, return {"cells":[]}.

Use only the supplied image and instructions. You have no tools, internet, code execution, or additional image requests. Produce the coordinates directly; do not return code, prose, Markdown fences, a count alone, or an image-generation request. The evaluation host saves your exact response as answer.json. Up to 4096 cells, 500000 total vertices, and 16 MB of JSON are permitted. Finding all cells and tracing their boundaries are scored against hidden annotations using one-to-one object matching; the primary score is TP/(TP+FP+FN) at intersection-over-union >= 0.5, with overlap thresholds 0.75 and 0.9 reported separately.
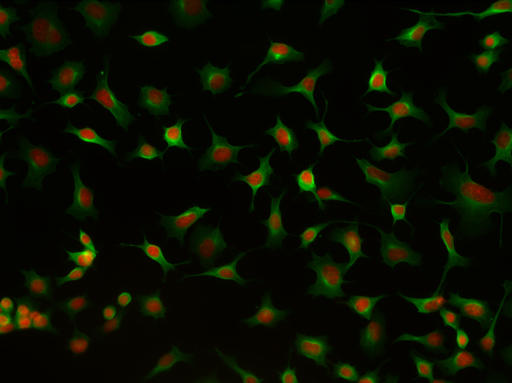 OriginalSegmented
Drag the divider to compare the original image with the predicted contours. Select a cell to inspect its outline.
Task & tools
Cultured Neurons
Loading task description…
Where to draw
Follow the outer edge of the cell body. Include clearly attached cytoplasm, keep touching cells separate and stop at the image boundary for partially visible cells.
Available tools
One supplied image and its instructions. No model-side tools, code execution, browsing, external models or additional data. The harness saves the final JSON response as answer.json.
Agent Context
Open Agent Context to read the files.
Protocol
Find the cell body
Look for a visible body around the nuclear signal. Trace neighboring bodies separately where they touch.
Walk the boundary
Record the ordered vertices of each outline. Use the original 512 × 383 pixel grid, with x increasing to the right and y increasing downward. At the image edge, trace the visible portion.
Submit the rings
Group each cell’s rings into one JSON entry. The verifier closes the rings, fills their interiors and matches the predicted objects to the human annotation.
Rubric
Continuous segmentation score
Loading the score definition…
Try an overlap
Move the predicted square across an example reference square. The overlap divided by the combined area determines whether this pair matches.
No binary pass threshold was declared for this delivery. Empty or malformed submissions score zero. Reported scores measure segmentation agreement on this image; they do not establish biological health or performance across a dataset.
Runs & evidence
Observed model results
Loading scored-attempt counts…
| Model / effort | Mean | Sample SD | Range | Scored / attempted |
|---|
Three scored calls per model on the Cultured Neurons image. Range and sample SD describe these calls; they are not confidence intervals. No aggregate dataset leaderboard is claimed.
Individual attempts & settings
Historical traces are excluded. Each row identifies its native result and request checksum in the downloadable record. Full raw traces and configurations remain in the reviewer delivery.
| Trial | Model | Score / outcome | Requested output limit | Observed input / output tokens |
|---|
QC & findings
The original delivery’s six-question QC is shown below. These question labels are distinct from the repository’s Step 5 and Step 6A/6B release workflow.
| Delivery check | Recorded status | Evidence and scope |
|---|---|---|
| Q1B · Benchmark evidence | Missing evidence | Observed cohort analysis exists. A linked M4 contamination assessment is missing. Exploratory binary sensitivity was chosen after the runs and is not the primary score. |
| Q2 · Scientific grounding | Pass | Real microscopy, human annotation provenance and workflow attestation. No measured expert performance baseline on this exact image. |
| Q3 · Runnable scoring | Pass | Saved-answer scorer replay and nine targeted scoring probes. This verifies saved-output scoring, not deterministic model generation. |
| Q4B · Criteria-based rubric | Not applicable | Continuous segmentation metrics; no criteria-based rubric or M12/M13 ratio. |
| Q5 · Training retention | Not applicable | Benchmark only; no training or retention experiment. |
| Q6 · Architecture | Pass · exploratory scope | Saved Harbor 0.24.0 / Modal runs, host-side Bedrock requests, no model-side tools or automatic retry; observed concurrency up to three. No buyer-load reliability qualification. |
This package establishes completed exploratory delivery. Full Step 5 approval, Step 6A/6B qualification and contamination clearance are not established by this evidence.
Sources & limits
Original reviewer delivery · GitHub access required
Artifacts are dated October 27, 2026; the release was published November 12, 2026. Reference masks, reference answers and gold-derived overlays are kept outside this website. The overlay shows model predictions from the six delivered answers. The results record identifies each answer file and its checksum.